Application Cases of Gantt Charts in Software Development: Why It's the "Invisible Conductor" for Team Collaboration
Have you ever experienced project delays due to chaotic task assignments? In the world of software development, a Gantt chart acts like an invisible conductor, silently coordinating the rhythm of every developer. Last week, a CTO from a startup shared with me: their agile development team always got into chaos during sprint phases, and they found out the root cause was the lack of a visual time management tool — this is exactly where application cases of Gantt charts in software development show their true value.
Unlocking the DNA of Gantt Charts
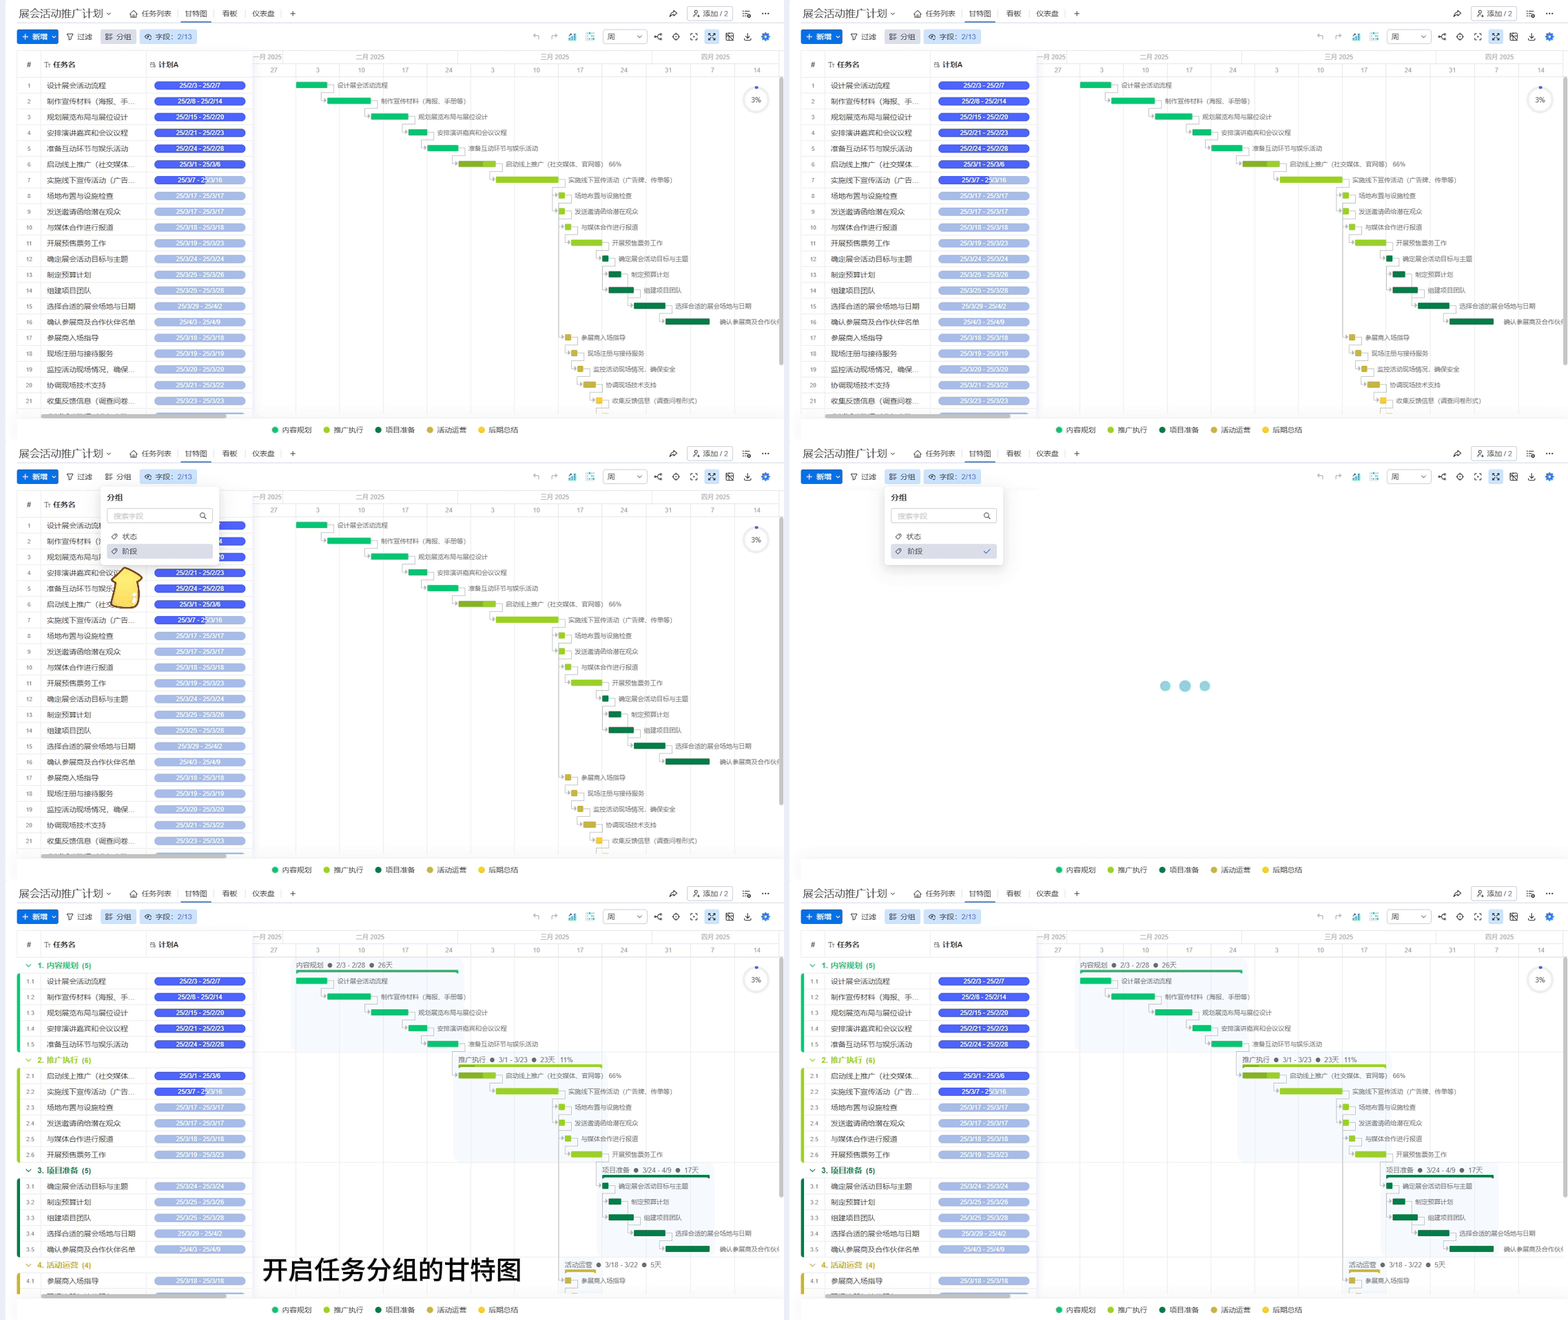
The Three Core Components:
- Task Compass: A complete list of all tasks from requirement analysis to deployment, much like the Qingming Shanghe Tu (a famous ancient Chinese painting) of development tasks.
- Time Tunnel: Precisely scaled timelines down to the hour, more sobering than caffeine.
- Dependency Network: Task relationships visualized with connecting lines, creating a network more complex yet orderly than Spider-Man’s web.
The biggest difference between traditional WBS (Work Breakdown Structure) and burndown charts lies in: the former is like a static map, while a Gantt chart functions as a dynamic navigation system. Especially in agile development iteration cycle management, it can morph like a chameleon—maintaining both the rigor of waterfall models and the flexibility of agile development.

The Dance of Software Development Scenarios
The "Time Manager" in Waterfall Models
In a banking system upgrade project, the technical director used Ganttable's milestone feature to compress over 300 tasks into a clear timeline. What stood out was its automatically generated dependency diagram, which allowed the front-end team to discover potential interface integration conflicts 8 days ahead of time — saving two full person-months worth of costs.
The "Elastic Magician" in Agile Development
Don’t say agile doesn't need Gantt charts anymore! A unicorn company in Hangzhou used Ganttable's sprint planning feature to achieve the following within two-week cycles:
- Daily visual progress tracking
- Automatically calculated remaining workload curves
- Drag-and-drop priority adjustments
Especially its AI-powered smart splitting function, capable of transforming product managers’ verbal requirements into task modules — practically a life-saver during requirement changes!
The "Stress Tester" for Team Collaboration
The most headache-inducing resource conflict issues become exposed under Ganttable's resource view. One Beijing-based game development team used color-coded indicators:
- Red for overloaded programmers
- Green for idle QA engineers
- Yellow for potential bottlenecks
Combined with its auto-rescheduling feature, the probability of project delays dropped by 40%. Honestly, since adopting this visual resource allocation method, our morning stand-up meetings have shortened by one-third.
Haven't you noticed we've entered the “Gantt+” era of modern software development? This article discusses how the construction industry uses Gantt charts to solve scheduling problems, but software development has even higher complexity — we must manage not only time but also unpredictable variables like requirement changes and technical debt. At times like these, Ganttable’s three completion percentage calculation methods are like giving project managers three "crystal balls of foresight," enabling them to see different possible outcomes based on decisions made.
Ultimately, Gantt charts aren’t just simple planning tools; they’re the second operating system for software development teams. Next time things get messy, why not give this old yet ever-evolving method a try — after all, even NASA uses Gantt charts to manage Mars exploration projects!

