The Core Role of Gantt Charts in Manufacturing Project Management: How Batch Size Optimization Eats Up Changeover Loss
Last week, a factory owner asked me, "Why does our production line always feel like a stuck gear, barely moving when we switch product models?" This question was like a key unlocking the most valuable secret in manufacturing project management — the golden combination of Gantt charts and batch size optimization.
1. Concept Clash: Gantt Chart VS Production Logbook
- Traditional scheduling tables are just like ledgers that only record "what got done today".
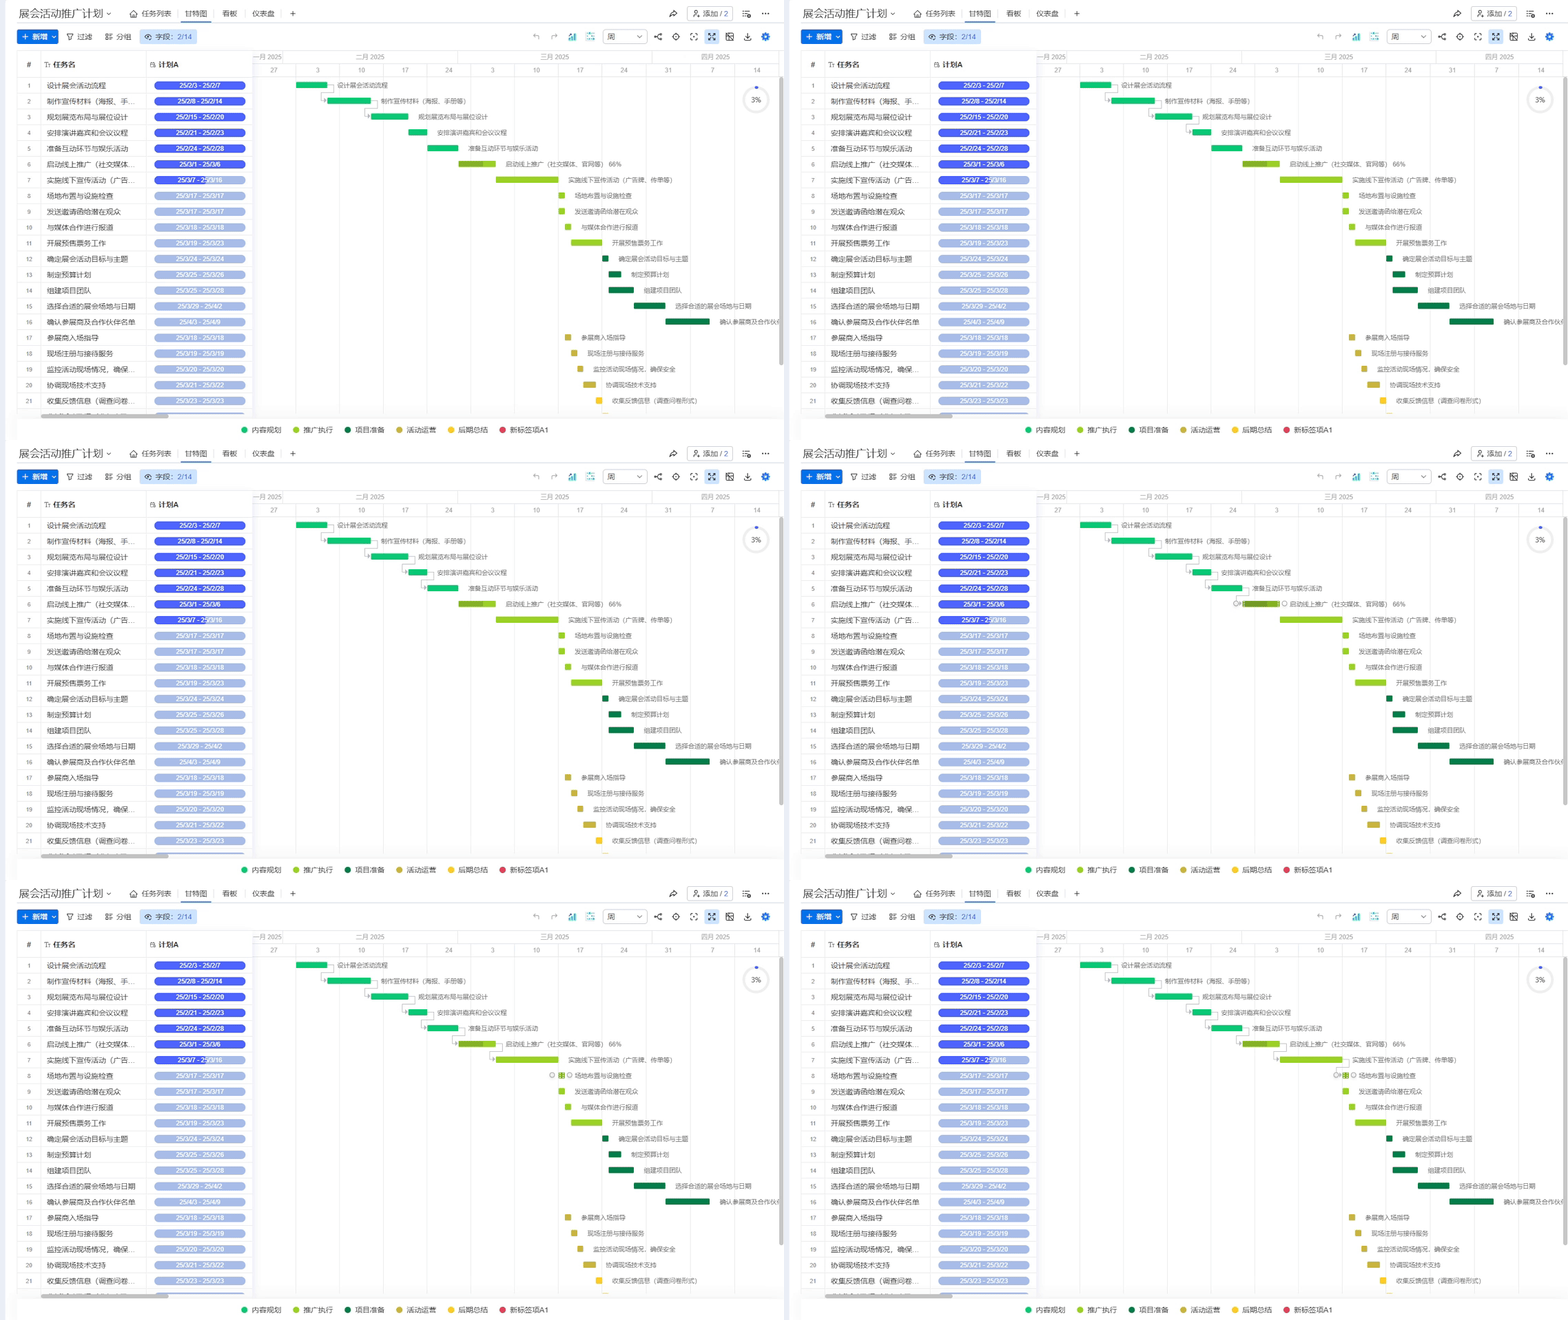
- Gantt charts, however, act as an X-ray machine, showing you where equipment idle time costs more than gold.
- Batch size optimization is a scalpel for precisely cutting away the tumor of production changeover loss.
For example, a beverage factory used to stop production for 2 hours every time it switched bottle types. After applying Gantt chart analysis across the entire production line, they discovered they could preheat molds while still producing, squeezing out an extra 40 minutes from the schedule!
2. The Magic of Ganttable
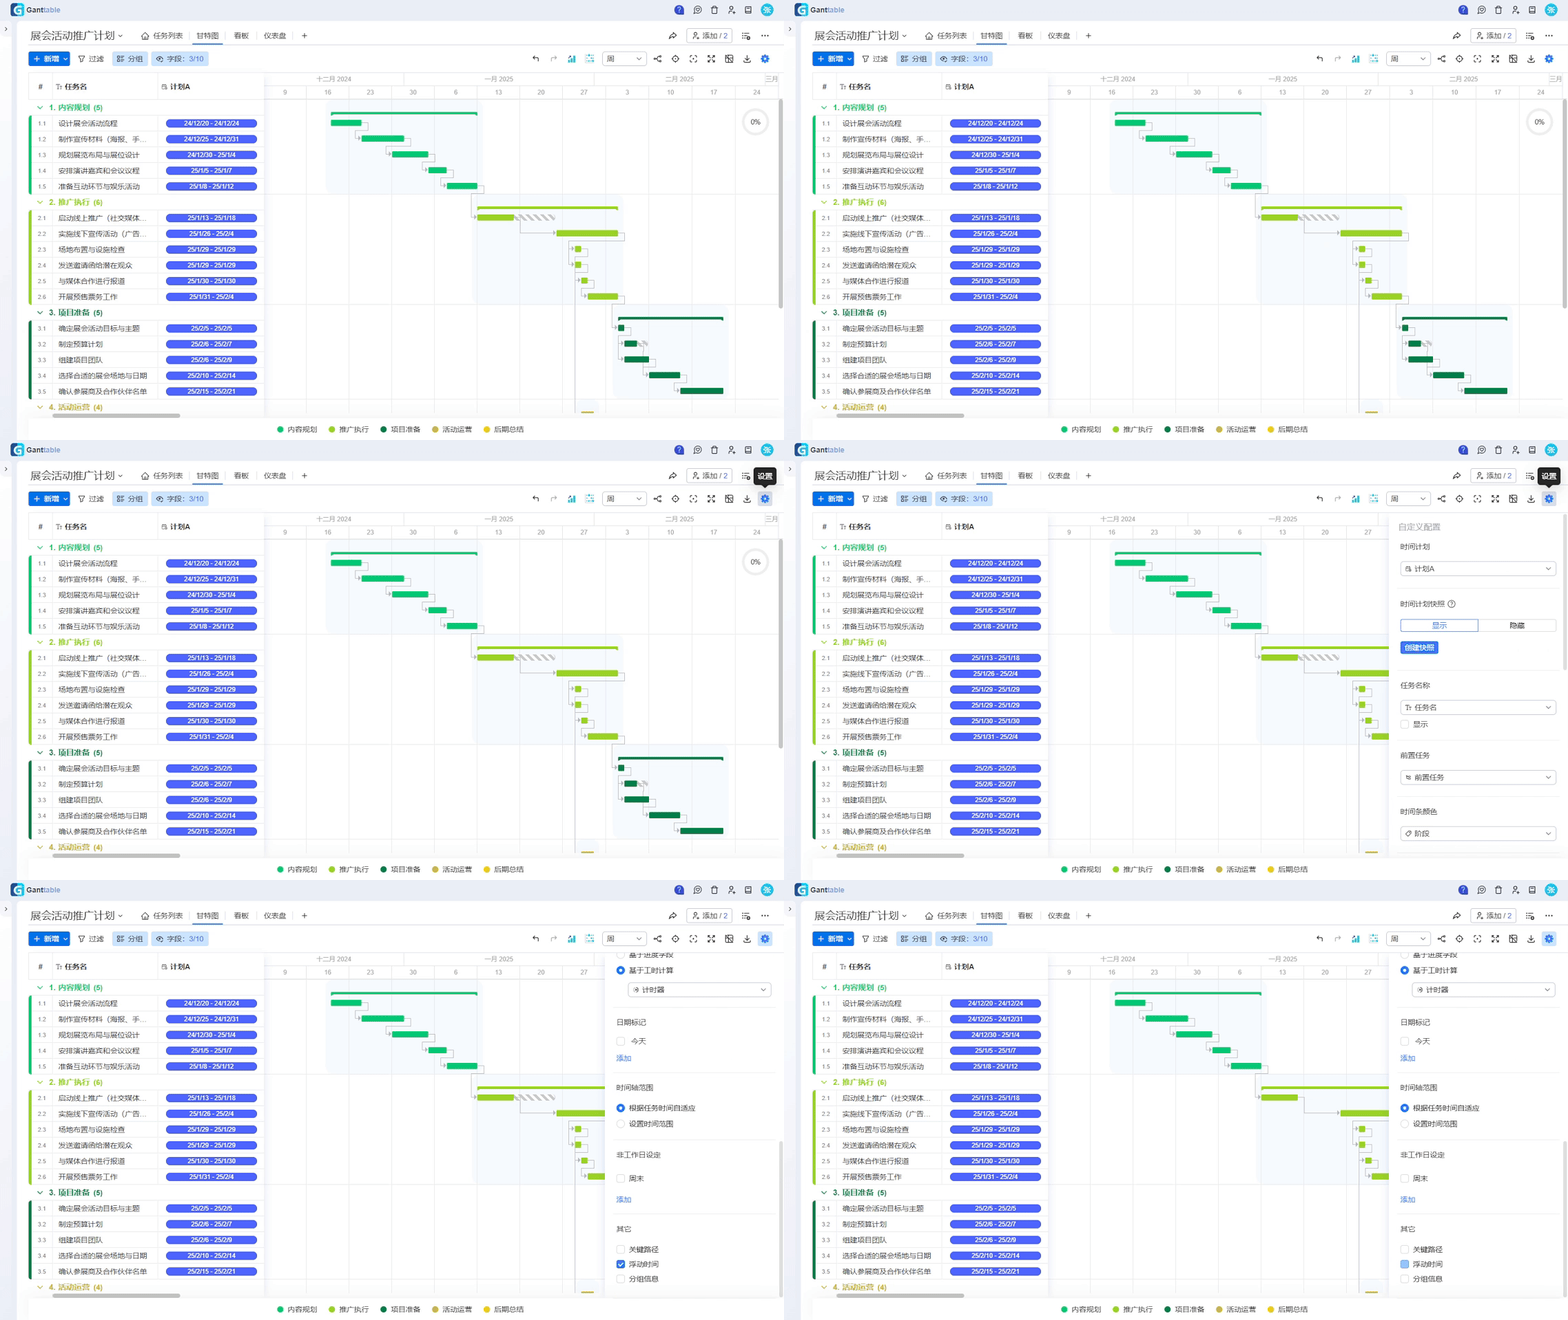
 Using Ganttable for scheduling feels like cheating—it makes dragging and dropping task blocks reveal changeover gaps. Once I helped a client use its critical path analysis, and we found the packaging line was idling 15 extra minutes every day, which equates to throwing away $20,000 in electricity costs annually!
3. Practical Guide to the EOQ Model
This formula4. SMED Quick Tricks
I personally witnessed magic at a Foshan hardware factory: skilled workers reduced stamping press mold changes from 45 to 18 minutes using these tricks:- Preheating measuring tools to working temperature
- Replacing screws with magnetic positioning blocks
- Conducting first-piece inspections during mold changes
 Combine this method with Ganttable's float time analysis, and scheduling flexibility instantly improves by 30%.
5. Real Case Study: Transmission Shaft Factory Turnaround
Let me share a hardcore story: A factory suffered 80 hours of monthly changeover losses. By applying the EOQ model to increase gear processing batches from 500 to 800 units, they slashed changeovers from 40 to 25 times per month. The savings? Enough to install brand new air conditioning for the entire workshop. The key was marking changeover windows orange on the Gantt chart—suddenly everyone understood where the time black holes were hiding.Honestly, writing this made me remember visiting a tire plant in Qingdao last year. They used Ganttable's AI-powered scheduling creation to input production plans directly generating 3D scheduling visuals—even interns could understand them instantly. Doesn't this embody the saying, "Great tools make complex problems as simple as screwing things together"?
Deep Practice of Quality Control Node Labeling and Gantt Charts in Manufacturing Projects mentions node labeling methods that distinguish changeover risk levels through color coding. It practically adds a radar warning system to your Gantt chart. Next time urgent orders come flying in, just apply their safety stock buffer formula

