2025-06-03
Gantt Chart Time Dimension Analysis: How to Precisely Control Project Progress?
Are you always encountering task delays without identifying bottlenecks in project management? Are you constantly looking for a tool that can intuitively display time constraints and automatically identify the critical path? Are you worried about traditional scheduling methods failing to handle complex dependencies? Don't worry, Ganttable is here to help! Its intelligent timeline modeling, dynamic path recognition, and resource load warning features will completely solve the problem of schedule失控.
1. Core Architecture of Gantt Chart Time Dimensions
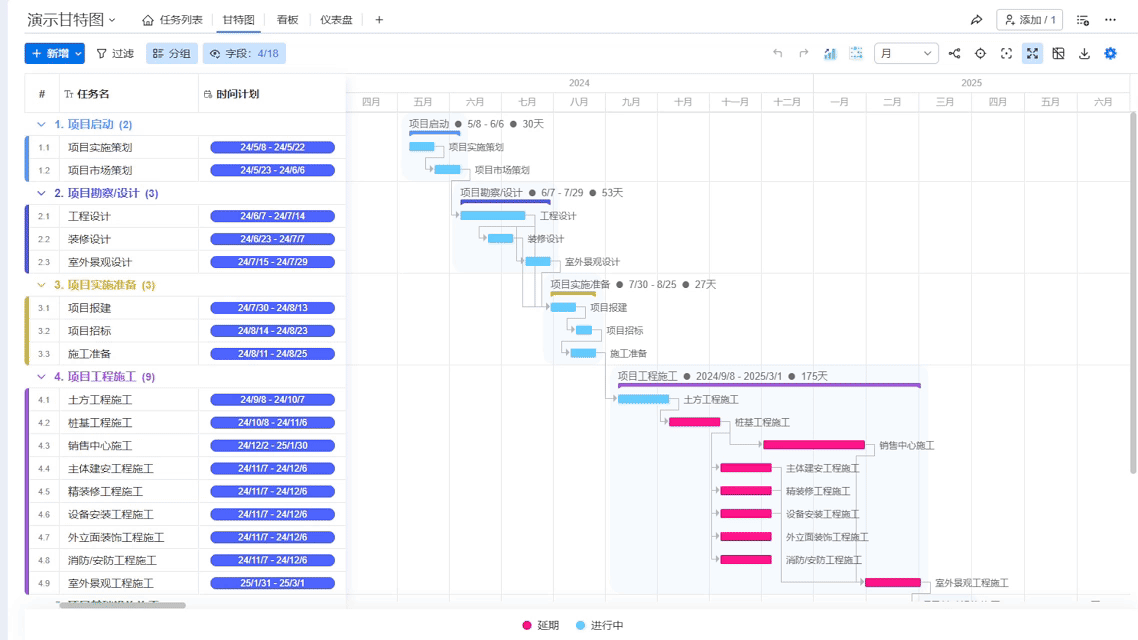
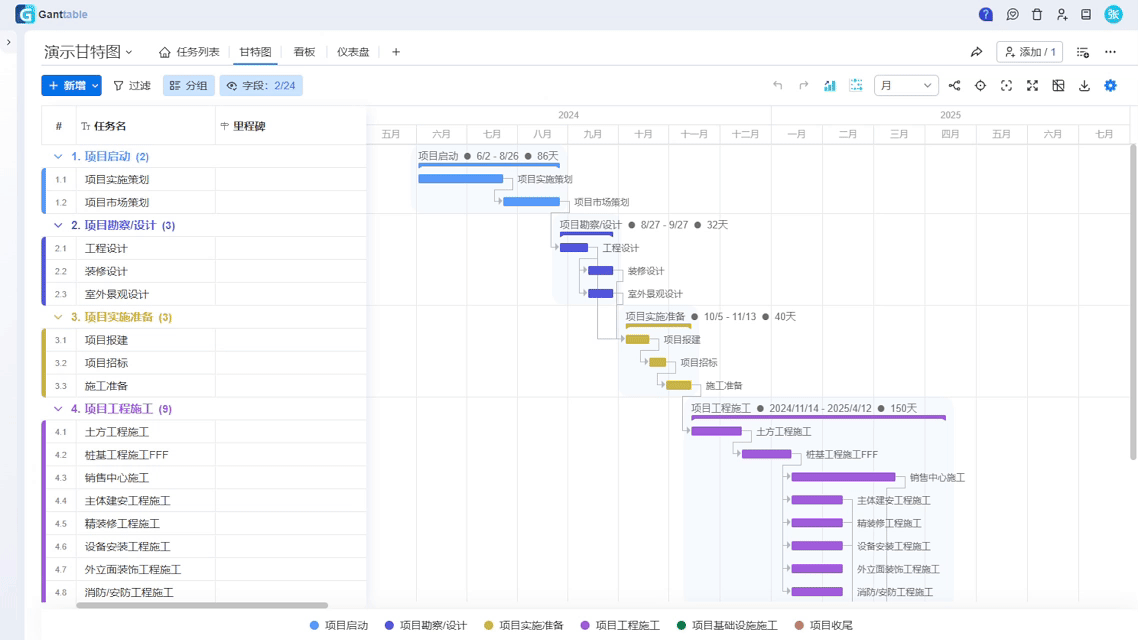
In the field of project management, Gantt charts are crucial for progress control due to their distinct time dimension characteristics. Through a matrix-style presentation of horizontal timelines and vertical task axes, the length of the bar graph precisely reflects the duration of tasks. For example, using the AI splitting function of Ganttable, an entire project cycle can be divided into multiple stages, each stage supporting specific start and end times.
For progress visualization, Ganttable's dual-color progress bar design stands out: planned progress is displayed with blue background and white line outline, while actual progress uses solid colors. Deviations in progress are clearly presented through color differences in overlapping areas. Combined with the Date Heatmap function, the bottom of the Gantt chart shows daily task density, with colors ranging from light red (fewer tasks) to dark red (resource tension), helping quickly identify potential bottlenecks.
2. Intelligent Critical Path Recognition Technology
When it comes to project critical path identification methods, tasks with zero total float time constitute the core path. The float time analysis feature of Ganttable can calculate the ES/EF (earliest start/end time) and LS/LF (latest start/end time) of each task in real-time and automatically mark the critical path. When non-critical paths experience delays exceeding the total float time, the system dynamically updates the core path, ensuring focus remains on the actual constraints.
According to Gantt Chart Critical Path Analysis and Fast Tracking Strategy, the length of the critical path determines the shortest possible project duration. Ganttable supports three types of project completion calculations (duration/progress field/current time). With milestone marking functionality, key nodes remain visible and controllable at all times.
3. Practical Application of Resource Constraint Integration
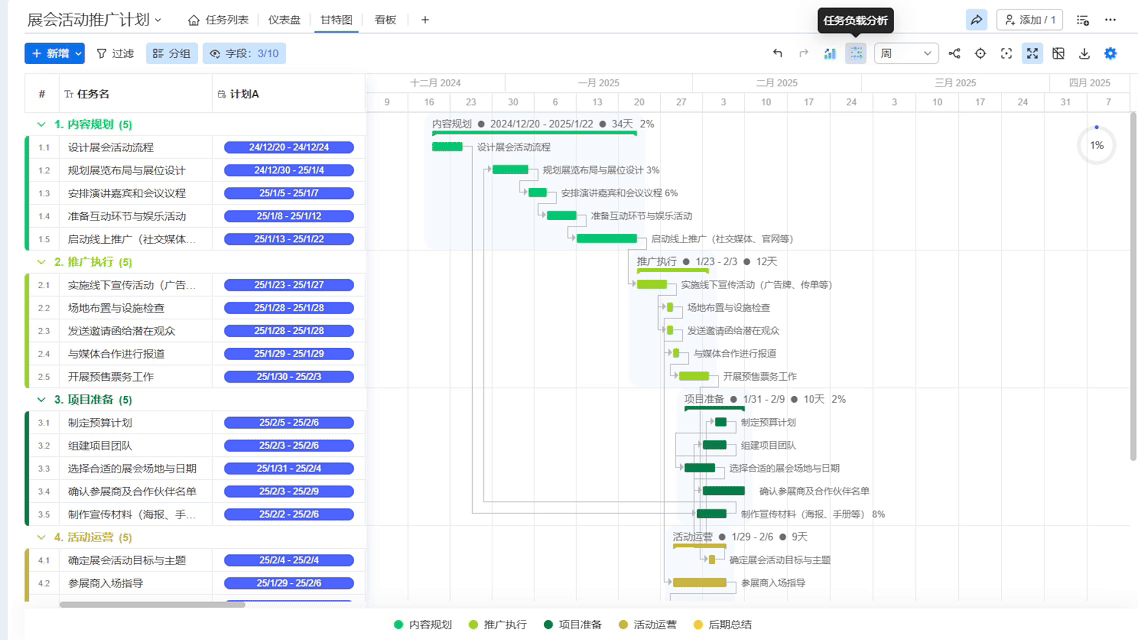
In scenarios involving resource constraint integration, Ganttable provides unique resource smoothing techniques. Through the work load analysis view, users can check daily task distribution. When dark red warnings appear, indicating resource tension, the system intelligently recommends adjustments to the time windows of non-critical path tasks. Additionally, custom non-working day settings are supported—apart from excluding weekends by default, holidays and other special dates can also be added to ensure plans align more closely with reality.
For complex dependency relationships, Ganttable's drag-and-drop arrow linking function perfectly supports the four logical relationships (FS/SS/FF/SF). When handling network topology breakpoints, the system automatically generates virtual activities that do not consume time but maintain structural integrity, as emphasized in Gantt Chart: The Invisible Conductor of Software Development Team Collaboration as a critical collaboration element.
4. Efficiency Improvement Secrets Summary
- Time Dimension Modeling: Achieve precise control over task durations through timelines accurate to the hour level.
- Dynamic Path Updates: Automatically recalculate the timing of all related tasks

