
2025-06-03
Gantt Chart Time Dimension Features and Project Management Practical Guide
Are you always encountering schedule delays in project management? Do you need a tool that can clearly display the Gantt chart time dimension characteristics? Are you worried about manually adjusting plans being time-consuming and error-prone? Don't worry, Ganttable is here to help! Its intelligent planning feature can accurately map the timeline and task hierarchy, while its floating time analysis function dynamically optimizes resource allocation.
The Core of Gantt Charts: Time Dimensions and Task Structure
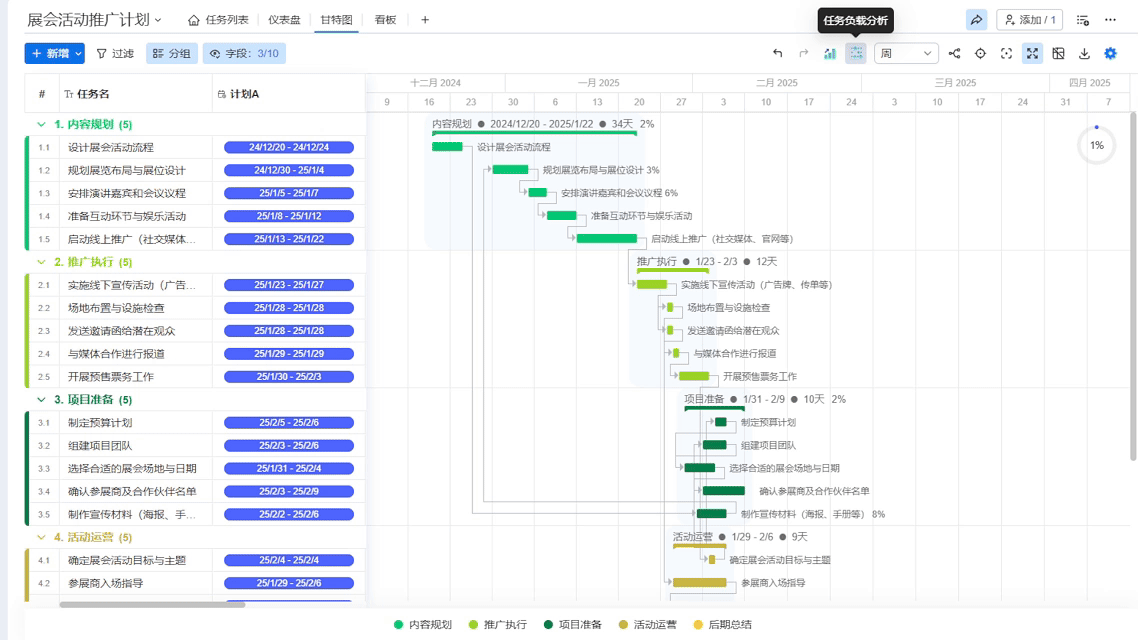
The essence of Gantt charts lies in breaking down complex projects into visualized time sequences. The horizontal time axis can be precise to an hourly scale, while the vertical task axis clearly presents hierarchical relationships through a graded numbering system. For example, in infrastructure engineering, the logical chain from earthwork to pile foundation construction, main structure, and then mechanical and electrical installation can be visually represented by bar lengths reflecting work hours. The comparison between planned progress (blue background with white lines) and actual progress (solid color filling) allows for quickly identifying deviation areas.
Critical Path Analysis: Accurately Identify Project Bottlenecks
Tasks with zero total float constitute the critical path, determining the shortest project duration. When non-critical paths experience delays exceeding their total float, the Ganttable critical index calculation function immediately issues a warning and verifies the logic of dependencies through topological sorting algorithms. For instance, in new product development, if prototype design is delayed, causing the total float to become negative, Ganttable's critical index calculation will promptly signal the risk.
Multi-Path Handling and Buffer Mechanism
When parallel critical paths exist, joint buffer zones must be set up. Ganttable supports adding project buffers (PB) at the end of critical paths and feeder buffers (FB) at the junctions of non-critical paths. This mechanism effectively handles unexpected delays—for example, if concrete supply delays affect main structure construction, the backup supplier system can quickly allocate resources from the PB.
Resource Constraint Integration: From Theory to Practice
Resource overloading is a common pain point during project execution. Ganttable's resource load heatmap reflects task density in real-time through color changes (from light red to dark red), helping managers anticipate bottlenecks. For instance, in a software development team, if tasks spike on a particular day (dark red cell), non-critical tasks' time windows can be adjusted via drag-and-drop to achieve resource smoothing.
Dynamic Updates and Scenario Adaptation: Meeting Complex Needs
Requirement changes often cause WBS and Gantt charts to fall out of sync during project execution. Ganttable supports automatic synchronized updates—when the Work Breakdown Structure (WBS) changes, corresponding task numbers and milestones are refreshed simultaneously, avoiding omissions caused by manual modifications. Additionally, it offers multiple scenario modes like table view, Kanban view, and dashboard, adapting to diverse needs from infrastructure projects to agile development.
Conclusion: Let Professional Tools Empower Efficient Management
Whether analyzing critical path identification methods or solving the issue of how to use Gantt charts to analyze project bottlenecks, Ganttable provides comprehensive solutions. Click the links below to explore more practical cases:

