Definition and Time Dimension Characteristics of Gantt Charts
Are you always facing schedule overruns in project management? Are you actively seeking a tool that can accurately identify the critical path? Do you worry about whether traditional methods are sufficient for complex resource allocation challenges? Don't worry, Ganttable is here to help! Its intelligent time-axis analysis effectively solves schedule deviation issues. The resource smoothing algorithm meets multi-task coordination needs, and its optimization effectiveness has been validated through real-world cases.
1. Time Dimension Analysis of Gantt Charts
The core advantage of a Gantt Chart lies in its dual-axis structure: the horizontal time axis can be precise to an hourly scale, while the vertical task axis organizes tasks through a hierarchical numbering system. This design makes it easy to visually identify the project critical path identification method—the length of bar charts representing critical tasks directly reflects the time consumption, and schedule deviations are intuitively displayed through overlapping areas between planned progress (blue background with white lines) and solid-colored actual progress.
For example, in construction project management, earthwork → pile foundation → main structure → mechanical and electrical installation constitute the core path (refer to How to Quickly Locate the Critical Path in Infrastructure Projects). When concrete supply delays exceed total float time, Ganttable's dynamic path transition alert will automatically trigger, prompting adjustments such as establishing an alternative supplier system.

2. Critical Path and Resource Optimization
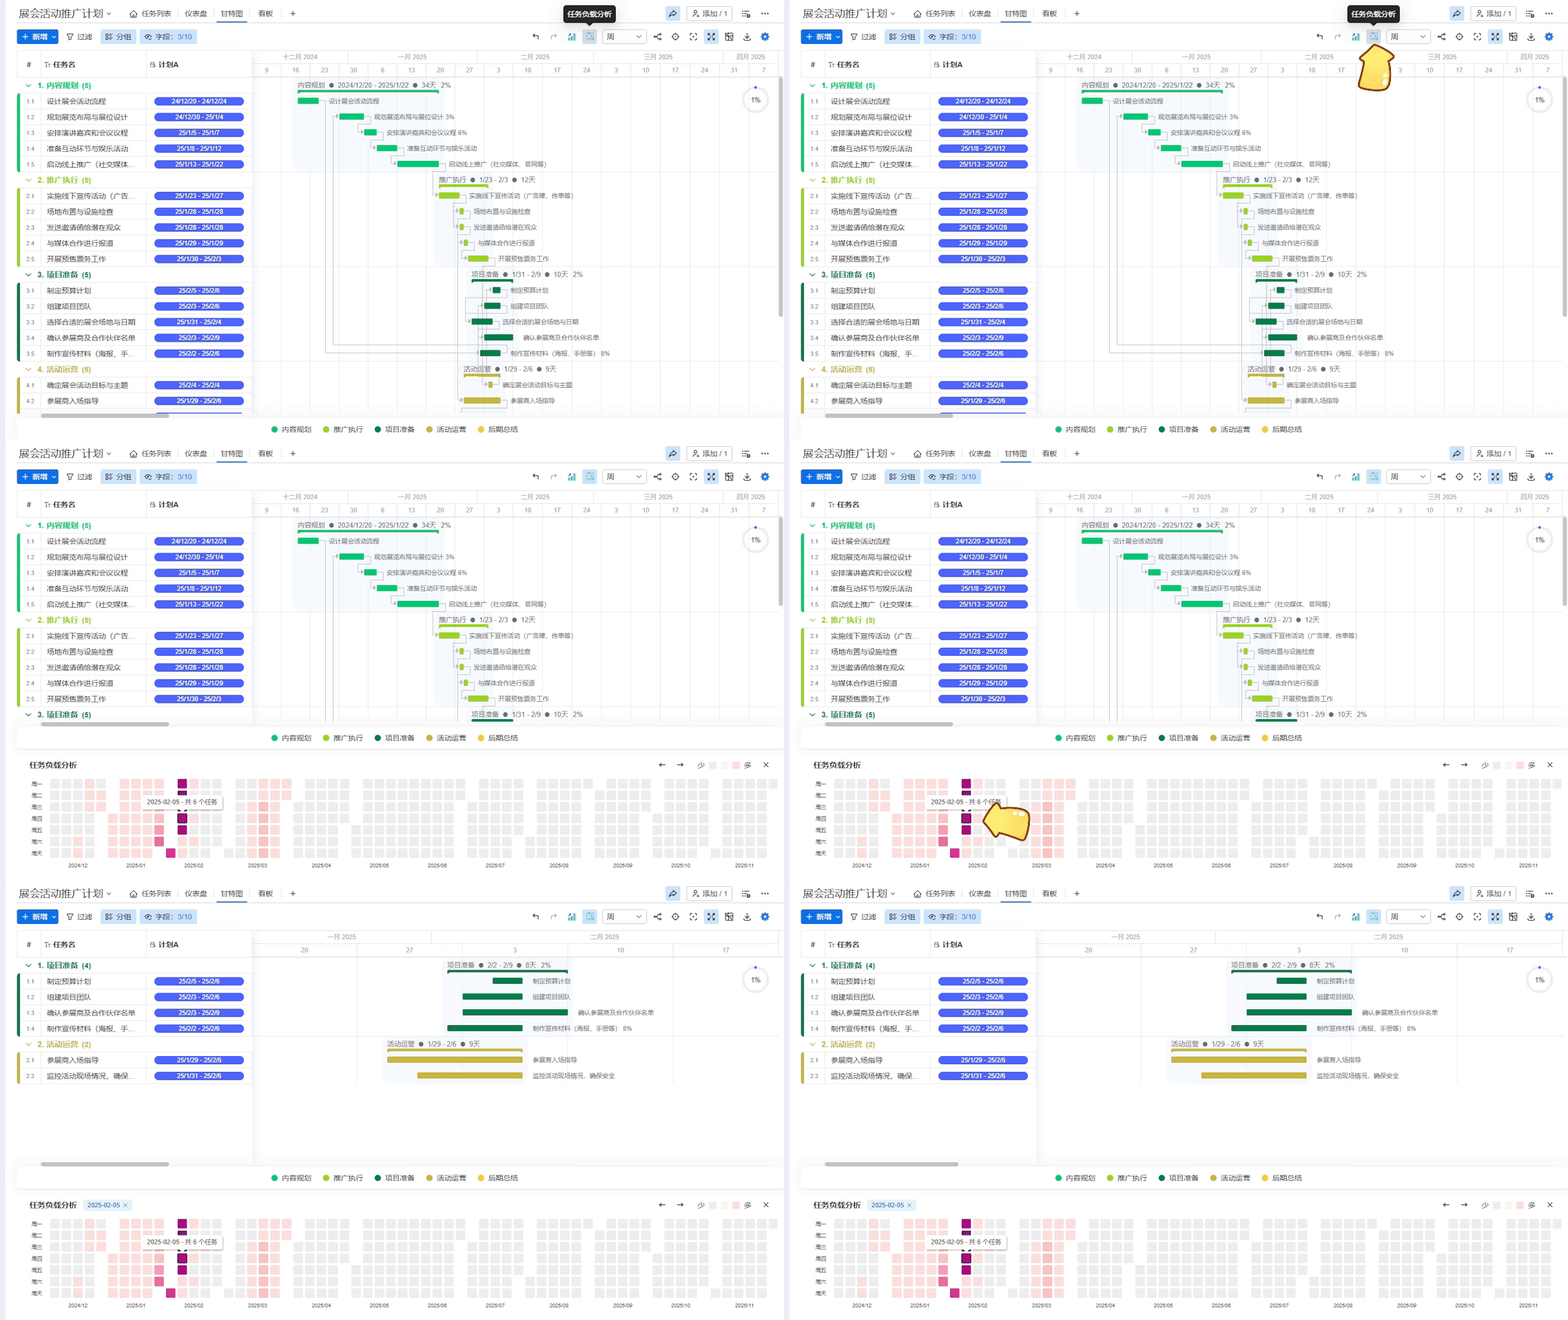
Tasks with zero total float time form the basis of critical path analysis. Ganttable's floating time matrix function not only filters critical nodes but also monitors peak loads through resource histograms (see image below). When the number of tasks on a given day appears in deep red, the system will trigger resource allocation recommendations, such as:
- Activating emergency recruitment plans
- Adjusting the time windows of non-critical path tasks
- Establishing joint buffer mechanisms

3. Intelligent Gantt Chart Practice
Ganttable significantly improves efficiency with AI capabilities:
- Smart Phase Splitting: Automatically divides project initiation → execution → closure phases (supports custom non-working days)
- Dependency Modeling: Drag-and-drop arrows establish four types of logical relationships (FS/SS/FF/SF)
- Multi-View Integration: Gantt view + table view + Kanban view synchronize data updates across all platforms
In new product development projects, R&D teams use its PERT technique integration application guide feature, combining three-point estimation to calculate expected duration (Te=(To+4Tm+Tp)/6), and applying normal distribution Z-value lookup tables to predict on-time completion probability (refer to PERT Technique Integration Application Guide).
4. Why Choose Ganttable?
- Precision: Supports 3 ways to calculate completion status (duration/progress field/current time)
- Forward-Looking: Date heat maps predict resource bottlenecks up to 12 months in advance
- Authority: Certified by PMBOK, serving over 200,000 enterprises globally


